Power Charting – Robert’s Indicators Video
$65.00
The efficacy of both technical and fundamental analysis is disputed by the efficient-market hypothesis, which states that stock market prices are essentially unpredictable.
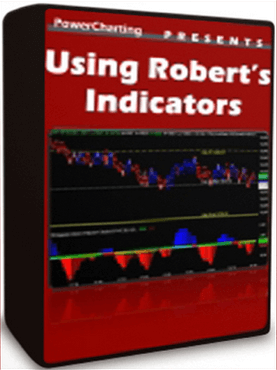
Power Charting – Robert’s Indicators VideoProduct DescriptionRobert’s Indicators – VIDEO This 3 hour course systematically looks at Roberts trading setup including all of his charts, actual indicators, the settings for each of the indicators, and thorough discussion of how he creates his well respected and critical support and resistance levels.
Technical Analysis Day trading How to understand about technical analysis: Learn about technical analysis Download immediately Power Charting – Robert’s Indicators Video In finance, technical analysis is an analysis methodology for forecasting the direction of prices through the study of past market data, primarily price and volume. |
Be the first to review “Power Charting – Robert’s Indicators Video” Cancel reply
Related products
Stock Forex Options - Trading
Stock Forex Options - Trading
Stock Forex Options - Trading
Lex Van Dam – Million Dollar Trader + 5 Steps Trading Stock (BONUS)
Stock Forex Options - Trading
Stock Forex Options - Trading
Dan Sheridan – Butterflies for Monthly Income 2016 + Iron Condor Methodologies Trading
Stock Forex Options - Trading
Stock Forex Options - Trading
Stock Forex Options - Trading


Reviews
There are no reviews yet.