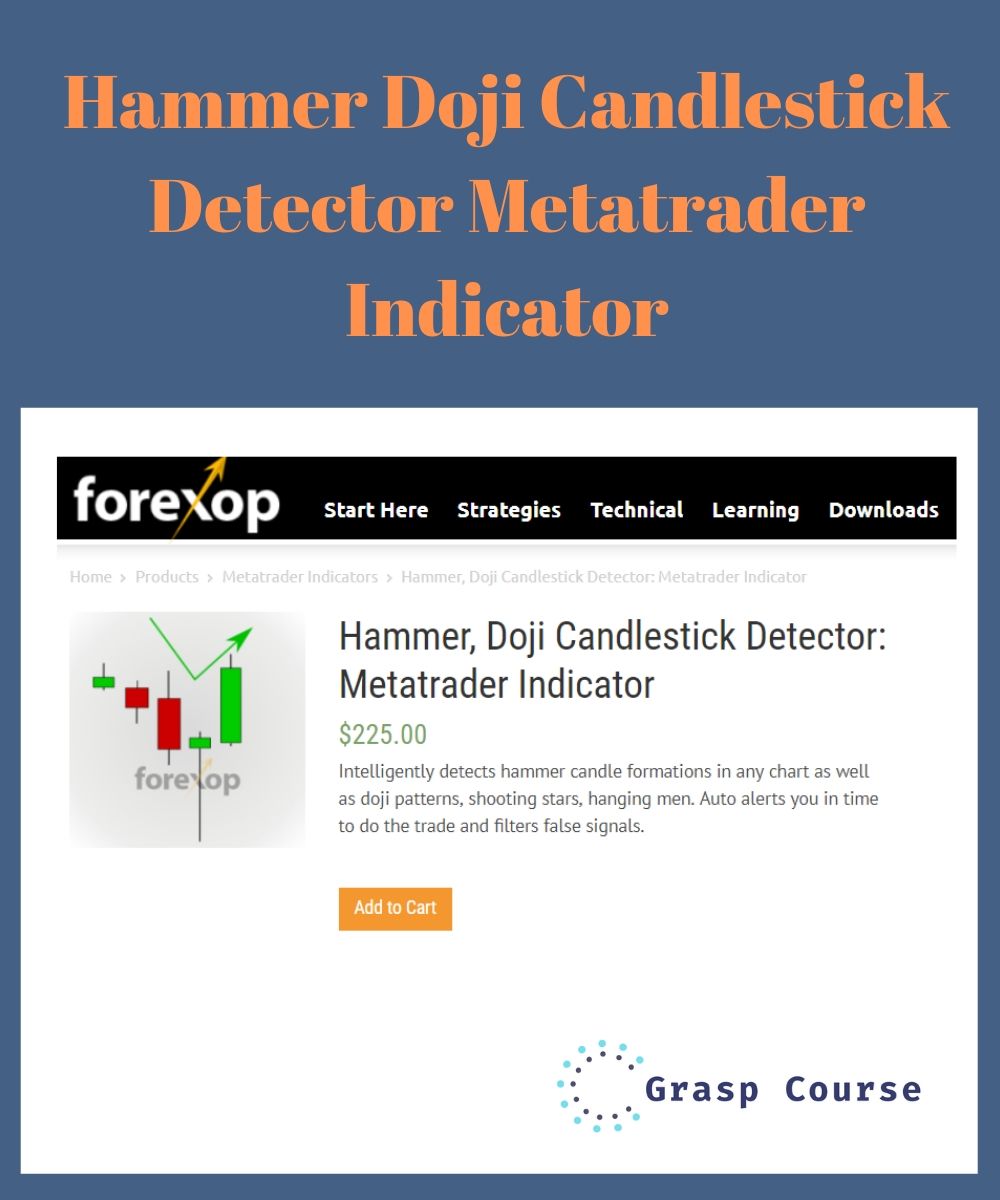
Hammer Doji Candlestick Detector Metatrader Indicator
$225.00 Original price was: $225.00.$125.00Current price is: $125.00.
Hammer Doji Candlestick Detector Metatrader Indicator
Sale Page: Hammer Doji Candlestick Detector Metatrader Indicator
This Metatrader indicator will scan the chart for any kind of hammer candlestick patterns. As a price action indicator it works in real time and will alert you instantly on detecting any hammer formation.
The settings let you to filter out the weaker or less clear cut cases to leave behind the strongest trading signals.
HAMMER CANDLES: AN INTRODUCTION
A hammer candlestick forms where the price makes a deep low and then makes a rapid recovery. This “recovery” is the key property that makes hammers useful for detecting price reversals. The recovery can either take the price back above the open level or just below the open.
In these cases as depicted in Figure 1, the resulting candles will appear on the chart as either a green hammer or a red hammer.

The shadow (or pin) length is a measure of how deep the price fell before recovering. A longer shadow indicates a deeper fall and a stronger the recovery.
A longer shadow suggests there will be more momentum behind the upcoming reversal. This is because it suggests that more of the bulls (“longs”) have been forced out of the market at lower levels.
Hammers usually form as a bearish trend enters its final phase. They are therefore bullish signals.
An inverted hammer is effectively just an upside down hammer where the shadow points the other way. Inverted hammers usually form as a bullish trend completes its cycle and the market prepares for a downturn.
Inverted hammers occurring after upwards trends are therefore taken as bearish signals. See Figure 2.
The indicator detects and classifies two different hammer types. The input setting “Detect hammer types” lets you choose from:
- Normal hammer patterns only
- Inverted hammer patterns only
- Any hammer pattern – will detect both types

USING HAMMERS TO DETECT REVERSALS
Hammers consistently appear as downtrends exhaust themselves as the balance moves from the bears back to the bulls. In a downtrend, both a green hammer and a red hammer are seen as bullish though the green hammer usually provides a slightly higher weighting signal.
The key points to look for in a hammer are the shadow length and the body position. Let’s look at each.
DEFINING HAMMER CHARACTERISTICS
The shadow length: The length of the shadow tells you how far the market fell before it capitulated. The capitulation is usually a very rapid event where market sentiment flips. Capitulations happen when those on the wrong side of the trend (buyers in this case) give up their positions and flood the market with sell orders. This wave of sell orders is often driven by a cascade of stop losses.
The result is that it pushes the price down rapidly and draws in new buyers who enter at more favorable levels. This provides the market with a fresh wave of upward impetus and momentum that enable it to break new highs.

The candle body has two important properties: The body length and the position of the body within the shadow.
The body length: A classic hammer candle has a short body in relation to the shadow. For a strong hammer, the shadow should be at least three times the length of the body. Some traders prefer a slightly stronger ratio such as 5x or even 10x the body length. But this also depends on the body size because sometimes (as in the case of doji) the body length is zero or close to zero.

The body position: The candle body position with respect to the shadow will give an indication on the direction the market was taking and which side was strongest. With a classic hammer you want to see the body positioned at the very top end of the shadow. This shows that a strong rebound was underway at the time the candle was forming and successfully brought the level back up to (or above) the open.
When the body is more central along the shadow the hammer signal is less clear. A candle with a central and very narrow body is called a doji.
A central body indicates there was strength on both sides and that either a) the capitulation failed to inspire enough buying to maintain any new highs. In this case the price fell back towards the open level. Or b) in the reverse case the price rallied initially but the higher levels triggered more selling which resulted in the price breaking lower again.
In both cases the signal is unclear. In this case it’s best to examine the lower time frames to understand the market dynamics.
Some traders will treat any hammer with a narrow body as a doji. But in my experience the position of the body is much more important than the body size itself.
SHOOTING STARS
Bearish hammers that are seen at the top of trends are often called shooting stars. In every way they’re identical to the classic hammer, just in reverse. The market dynamics are the same only the direction of the market is different.
Typical shooting star hammers are shown in Figure 5.

SIDE CASES: THE “DOJI” AND THE “HANGING MAN”
THE DOJI
As I mentioned above when trading hammer signals there are a few side cases that you need to be prepared for. The doji as shown in Figure 6 on the left indicates that the market is indecisive. When this candle appears it can be a sign that the existing trend has further to run. In this case it’s best to wait for the next candle to check if the market really is gaining strength in the new direction.
It could simply be that the trend is pausing and further downside pressure is developing. As I explained above the doji can be seen as a slightly bearish signal in a downtrend. This because of the fact that as the market broke new highs it brought in more selling rather than buying.
The doji often happens where a capitulation was premature or too weak to propel the market upwards with enough momentum.

THE HANGING MAN
The only difference between a hanging man and a hammer is the position within the trend. They are the same in appearance so you need to examine the preceding bars and the trend to determine the market sentiment.
The hanging man (or inverted hanging man) happens when the existing trend reverses temporarily and then recovers. The hanging man often happens as the market digests a new piece of fundamental data – an economic release for example.
The “hanging man” marks a sudden change in sentiment and direction in which there wasn’t any time for a capitulation to develop.
The rapid fall and recovery indicates that one group of traders (the smaller group) interpreted the news as bearish. But the broader market consensus, which takes a bit longer to assert itself, disagreed with this view and kicked the market back up again.
Hanging men can be traded as trend continuation signals. But this does carry high risk in that they can sometimes forewarn of sudden and steep corrections.
For more information see the technical guide.
___________________
***** Terms of Sale *****
* After payment, we will send you a link to access and download the course anytime you want.
* We just refund you in case of:
(1) Item is not as described
(2) Item doesn’t work the way it should
(3) Item support is promised but not provided
GRASP COURSE – Partners For Your Success
More Courses: Business & Marketing
Be the first to review “Hammer Doji Candlestick Detector Metatrader Indicator” Cancel reply
Related products
Business & Marketing
Business & Marketing
Business & Marketing
Business & Marketing
Business & Marketing
Business & Marketing
Mother of All E-Commerce Walkthroughs – Building a Brand New e-Com Store
Business & Marketing
Business & Marketing


Reviews
There are no reviews yet.