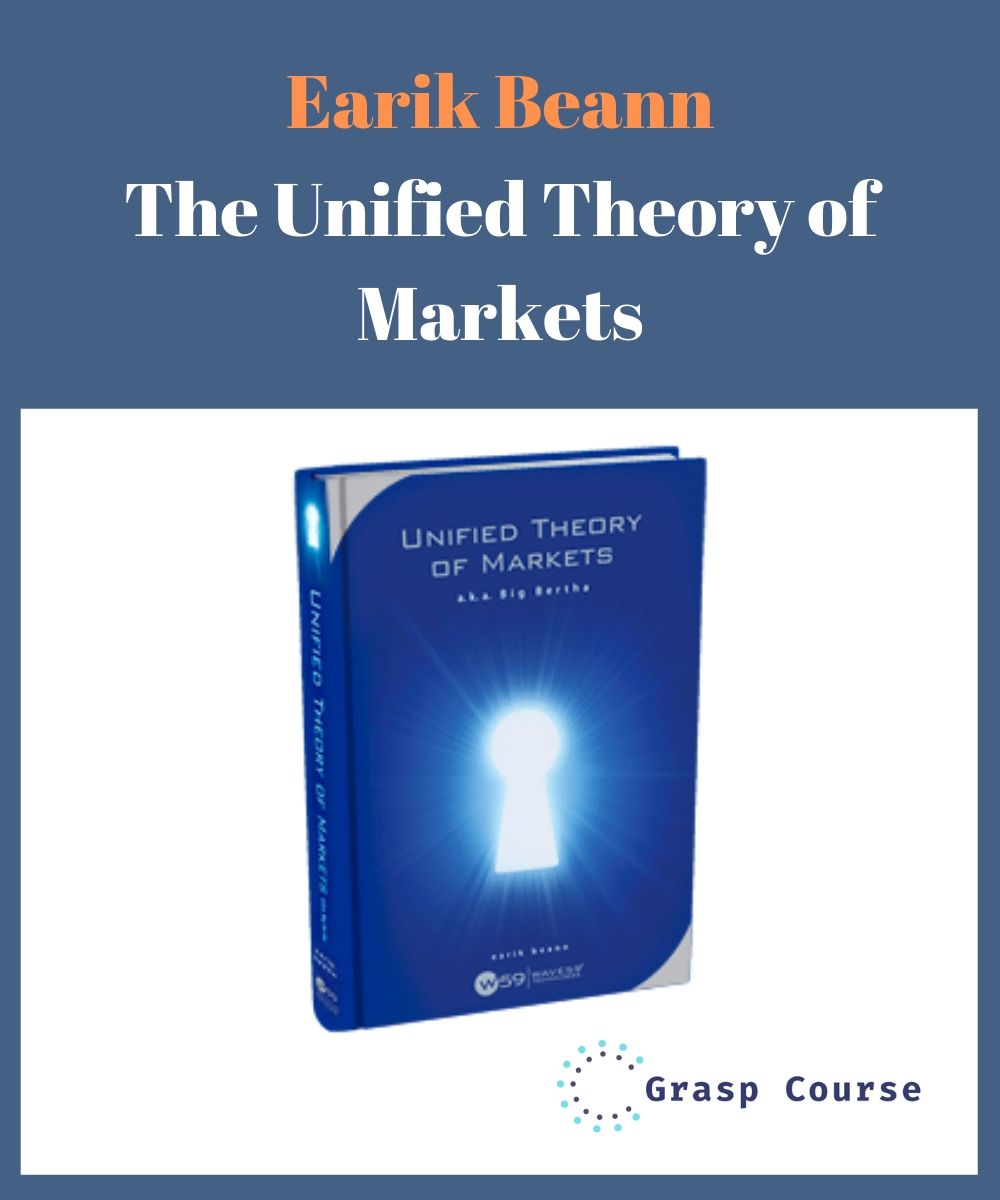
Earik Beann – The Unified Theory of Markets
$2,995.00 Original price was: $2,995.00.$202.00Current price is: $202.00.
Earik Beann – The Unified Theory of Markets
Sale Page: Earik Beann – The Unified Theory of Markets
This course reveals the underlying theoretical structure behind all market movements, and represents the culmination of 20 years of research into natural law in financial markets. This is the most important and powerful work that Earik has ever presented, and represents the crown jewel of his trading techniques. All purchasers of this manual will gain access to a members-only bulletin board where they may interact with the author and other users of this material
LL HIGHS AND LOWS, ON ANY TIME FRAME AND MARKET, ARE GOVERNED BY A SINGLE PATTERN THAT RUNS THROUGH ALL FREELY TRADED MARKETS |
The Unified Theory of Markets describes what this pattern is, and how to use it |
This course reveals a collection of tools (collectively known as “Big Bertha”) that work together to explain why turning points, trends, and support and resistance all form where they do on the charts we see. Unlike other methodologies, this material focuses on the underlying structure behind market movements, which means that rather than acting like random signal-generators that issue buy and sell signals every now and then when certain conditions are present, these tools describe the forces that actually cause markets to do what they do. As such, once you understand the laws that Bertha is based on, you will also be able to explain every single important turning point in any market, on any time frame, going back to be beginning of recorded history. More importantly, you will be able to forecast what the market will do in the future, and will be able to locate the most opportune places to enter trades.
There are four important principles in the Bertha material, each of which is critical to having a complete knowledge of market dynamics. Those four principles are:
Principle 1: The Market’s Fingerprint Understand the underlying pattern behind all market movements |
| Ultimately, all markets are governed by a single pattern that determines where turning points form, and whether those turns are highs or lows. This one master pattern, created by the collective subconscious minds of all traders everywhere, is behind every twist and turn on any financial chart, and creates the structure within which market prices fluctuate. Luckily for us as traders, it is a cyclical pattern, which means that it repeats again and again, and once you know where you are in the current part of the pattern, you then also know what to expect in the future. Unlike other cyclical techniques, this pattern has never inverted, has never missed a turn, and can be projected infinitely far into the future. |
Principle 2: Market Structure Know whether the trend is up or down |
| What is the reason that most Gann, Astro, and Geometry traders tend to be great analysts but terrible traders? The reason is that they almost always trade against the trend. Trying to buy bottoms in a downward trend, and trying to sell tops in an upward trend is a recipe for a blown account. However, if you understand the underlying structure behind price action, you will also understand why markets form extended trends and where those trends will occur. More importantly, you will know, at any given moment, whether the market wants to go up, or whether it wants to go down. Simply going with the trend will allow you to be late, make mistakes, and suffer slippage on your orders and still make a profit. Understanding market structure is the key to being able to trade turning points successfully, and this information alone represents the difference between ending up with a profit or loss at the end of the day. This is the critical missing piece that most traders have to understand before becoming successful. |
| Principle 3: Projection Tools Know where the next high or low will form |
| Countless techniques have been devised to try and forecast where tops and bottoms will occur in the future. Most work some of the time, but few work most of the time. Once the true structure of the market has been identified, the market itself will present and entirely new set of tools that can be used to forecast, with very high accuracy, when to expect the next turn, in both price and time. Unlike tools that work every now and then, these same tools can be used in the same way on every single turn, both highs and lows, from second-based charts all the way up to yearly charts. Learn to see where turning points will form in the immediate future, based on the same natural laws that create those turning points in the first place. |
| Principle 4: Proper Scaling Unlock the truth by plotting charts properly |
| Markets are geometrical in nature, but it is difficult to see this geometry without properly scaling a chart. Once the underlying structure of the market is known, it is very easy to know the correct scale factor that determines the relationship between price and time. That scale factor is also used to plot a chart correctly on a graph. If and only if the proper scale is used, the internal geometry inherent to all markets will reveal itself. At that point, calculating support and resistance levels in the future becomes a trivial task. Legendary trader WD Gann understood these principles, and gave us the 50% rule and his Gann Angles. Unfortunately, both tools are useless without proper understanding on how to find the true scale of a market, which requires knowledge of the master pattern. You will learn to see what Gann did, and will be able to exploit the mathematical connection between all highs and lows on a chart in your own trading. |
Our minimum target was quickly attained, and our expected low held. The market is now rallying as expected. How long will the rally last, and should we try to get in on it? Answering that is simply a matter of applying our four principles to get both the general roadmap moving into the next few days, as well as the exact forecasts for the highs and lows that we are looking at. Each high and low is mathematically connected, and they are all part of one universal pattern that governs all markets. Once you understand the pattern, forecasting the market is a relatively simple task. You’ll notice that our longer term forecasts do get adjusted as we get closer to them, so purists may claim that we are “cheating” by allowing them to be updated. That’s OK. Although this manual contains forecasting material, it is not about forecasting. Forecasting doesn’t put money in your account. This manual is about trading. Specifically, it’s about how to find those points on the price chart that allow a trader to risk only a small amount to make a much larger profit. This is the key to successful trading, and what separates the professionals from the rest of the pack.
This material is the culmination of 20 years of research into natural law in markets. If you’ve ever used Wave59’s proprietary indicators, or have explored any of the methods written about in our books or conference presentations, you will know that they represent an extremely innovative and powerful library of techniques. Big Bertha is the crown jewel of this collection. It is the ultimate technique, and as close as we’ve gotten or ever expect to get to a universal solution to market movements. It was not an easy decision to release this material, and this book has been in the making for over three years. But ultimately, these tools were inspired by the Wave59 Community, and without the support, encouragement, and positive energy from its members over the years, this material would likely never have been developed. On the 20th anniversary of Earik’s trading career, and at the time of an important turning point within Wave59 as a company, it is finally time to release this work.
The price of this manual is $2,995. We feel this is a price that will allow all sincere students of the markets to acquire these tools, while not devaluing the material. Books like this come across once in a blue moon, and we don’t expect to be able to offer anything similar in the future. We believe it is worth more than 100 times what we are asking, so it represents a tremendous value. Please take this opportunity to purchase your copy while this offer is still available.
___________________
***** Terms of Sale *****
* After payment, we will send you a link to access and download the course anytime you want.
* We just refund you in case of:
(1) Item is not as described
(2) Item doesn’t work the way it should
(3) Item support is promised but not provided
GRASP COURSE – Partners For Your Success
More Courses: Stock Forex Options – Trading
Be the first to review “Earik Beann – The Unified Theory of Markets” Cancel reply
Related products
Stock Forex Options - Trading
Stock Forex Options - Trading
Stock Forex Options - Trading
Stock Forex Options - Trading
Stock Forex Options - Trading
Stock Forex Options - Trading
Anton Kreil – Professional Options Trading Masterclass (POTM)
Stock Forex Options - Trading
Stock Forex Options - Trading







![Oil Trading Academy - Code 1 + 2 + 3 [Video Course]](https://graspcourse.net/wp-content/uploads/2019/07/Oil-Trading-Academy-Code-1-2-3-Video-Course-300x400.jpg)


Reviews
There are no reviews yet.