Andrew Cardwell – Basic RSI Course
$40.00
Andrew Cardwell Basic RSI Course [Download]
1️⃣. What is Andrew Cardwell’s Basic RSI Course:
The “Andrew Cardwell’s Basic RSI Course” offers a deep dive into the Relative Strength Index, a vital trading tool. It helps traders predict market trends and make smarter investment choices.
Through detailed guides and audio lessons, the course breaks down the complexities of RSI. Students learn how to apply RSI principles to real trading scenarios, enhancing their ability to forecast market movements accurately.
This course is ideal for traders seeking to sharpen their technical analysis skills. It provides both foundational knowledge and advanced strategies in a clear, straightforward manner.
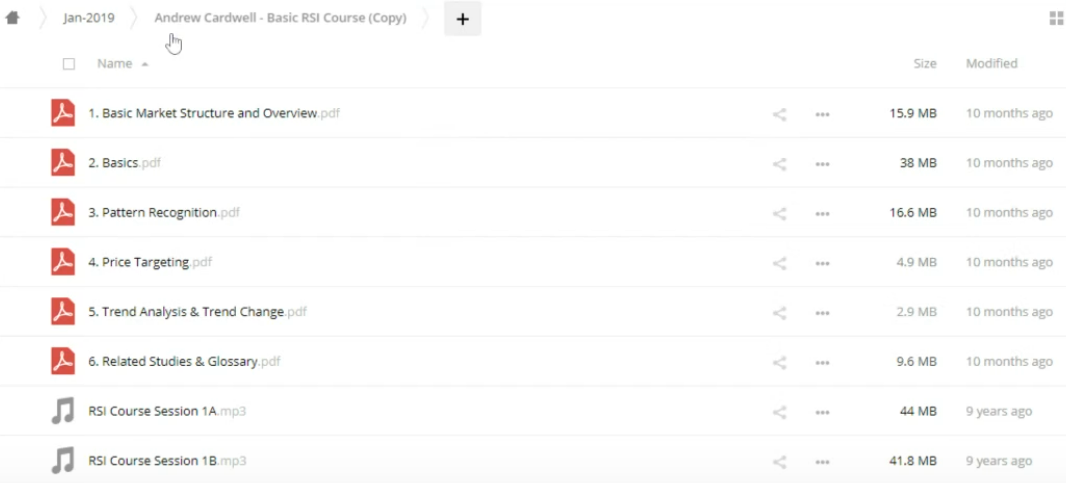
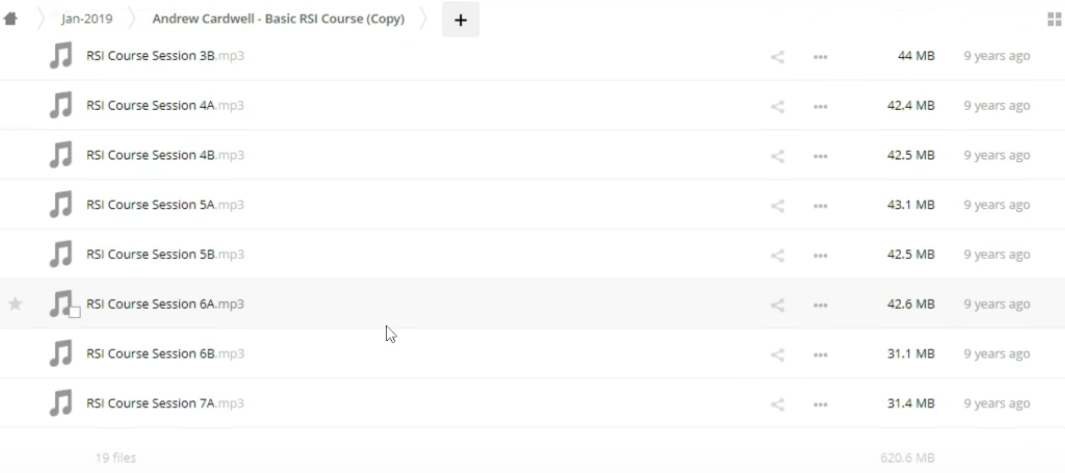
📚 PROOF OF COURSE


2️⃣. What you will learn in Basic RSI Course:
In the “Basic RSI Course,” you’ll gain comprehensive insights into:
- Understanding the foundational principles of the Relative Strength Index (RSI).
- Mastering RSI calculations and optimal time period selections for varied trading scenarios.
- Learning to identify divergences and reversals to predict market movements.
- Applying RSI for effective risk management and maximizing trading probabilities.
- Enhancing trading strategies with advanced RSI pattern recognition techniques.
This course equips you with the skills to analyze and interpret market trends, improving your trading effectiveness significantly.
3️⃣. Basic RSI Course Curriculum:
The “Basic RSI Course” includes a detailed 125-page manual and 13 audio CDs, totaling 11 hours of content. This curriculum extensively covers key trading concepts.
Topics include Range Rules, Divergences, Positive/Negative Reversals, and methods to evaluate Reward/Risk ratios. It also emphasizes Probability, Money Management, and trading Psychology.
This structured approach equips traders with essential skills for effective market analysis and decision-making, enhancing their trading proficiency.
4️⃣. Who is Andrew Cardwell?

Andrew Cardwell is a renowned expert in the field of technical analysis, primarily known for his deep expertise with the Relative Strength Index (RSI). Beginning his career in trading in 1978, Andrew quickly pivoted to focus on technical aspects, creating his own unique RSI-based trading methodologies. His extensive experience and innovative approaches have made him a respected figure in the trading community.
Over the years, Andrew has taught his proprietary RSI courses to a global audience of traders, brokers, and financial managers. His teaching has been so impactful that over 70% of his students come through referrals. Andrew’s contributions to technical analysis have been recognized on platforms like CNBC and in publications such as Futures magazine. He is often referred to as “Dr. RSI” for his authority in the field.
5️⃣. Who should take this course?
- Beginners: Those new to trading will find a solid foundation in technical analysis.
- Experienced Traders: Seasoned traders can refine and enhance their technical skills with advanced RSI strategies.
- Financial Professionals: Brokers and money managers will benefit from in-depth RSI knowledge to better serve their clients and manage risks.
The course is designed to be accessible yet challenging, providing valuable insights for anyone interested in mastering RSI in trading.
6️⃣. Frequently Asked Questions:
Q1: What is a good RSI signal?
A good RSI signal depends on the context, but generally, an RSI reading below 30 suggests an asset is oversold, while above 70 indicates it may be overbought. These levels can signal potential reversal points.
Q2: How do you use the RSI indicator to predict price movements?
To predict price movements with RSI, look for divergences where the price and RSI are moving in opposite directions. This can indicate a potential price reversal. Also, monitor RSI levels crossing above or below key thresholds (30 and 70) for buy or sell signals.
Q3: How to avoid RSI false signals?
To minimize false signals, combine RSI with other indicators like moving averages or MACD for confirmation. Also, consider using higher time frame charts as they tend to provide more reliable signals.
Q4: What is the RSI 30 70 strategy?
The RSI 30 70 strategy involves buying when the RSI falls below 30 (indicating oversold conditions) and selling when it rises above 70 (indicating overbought conditions). This strategy is used to identify potential reversal points in the market.
Q5: What is the difference between MACD and RSI?
MACD (Moving Average Convergence Divergence) is a trend-following momentum indicator that shows the relationship between two moving averages of a security’s price. RSI (Relative Strength Index), on the other hand, measures the speed and change of price movements to identify overbought or oversold conditions.
Be the first to review “Andrew Cardwell – Basic RSI Course” Cancel reply
Related products
Other Courses
Other Courses
Other Courses
Other Courses


![Penina Petersen – Freezer Meals 2: $1.50 Dinners – Veg Extras [eBook & Video Guides]](https://graspcourse.net/wp-content/uploads/2022/02/Penina-Petersen-–-Freezer-Meals-2-1.50-Dinners-–-Veg-Extras-eBook-Video-Guides-300x206.png)


Reviews
There are no reviews yet.